New Clinical/Statistical SAS Programmer
Both pharma and medical device SAS programmers can benefit from this page. The process chart and topics below useful to new Clinical SAS® Programmers. Other topics within the pharmaceutical section are more advanced topics such as CDISC. See also CDISC 101 Mapping Training videos, Statistical Analysis and New to SAS® Programming. See Introduction to Pharma Webinar.
- A. Study_Objectives
- B. Pharmaceutical_Terms
- C. Sample_Clinical_Trials_Study
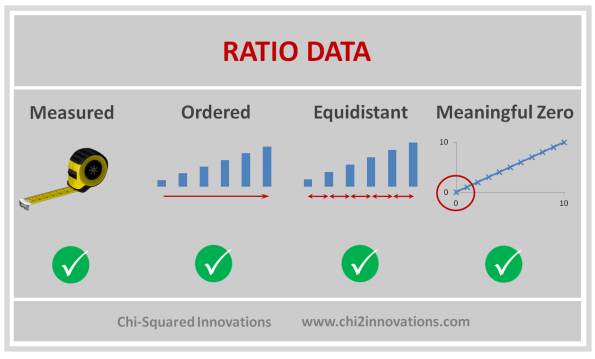
- D. Three_Types_of_Data_Collected
- E. Three_Types_of_Joins
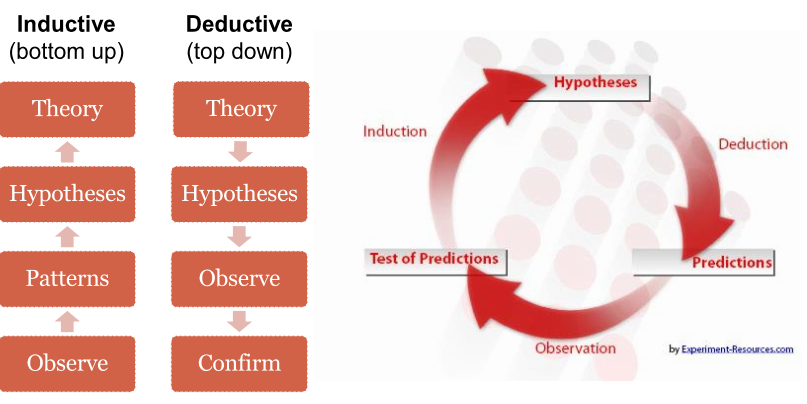
- F. Two_Types_of_Analysis
- G. Five_Types_of_Tables (Clinical Reporting)


SOPs: SAS Requirements, Testing and Validation, MindMap
A. Study Objectives (Top)
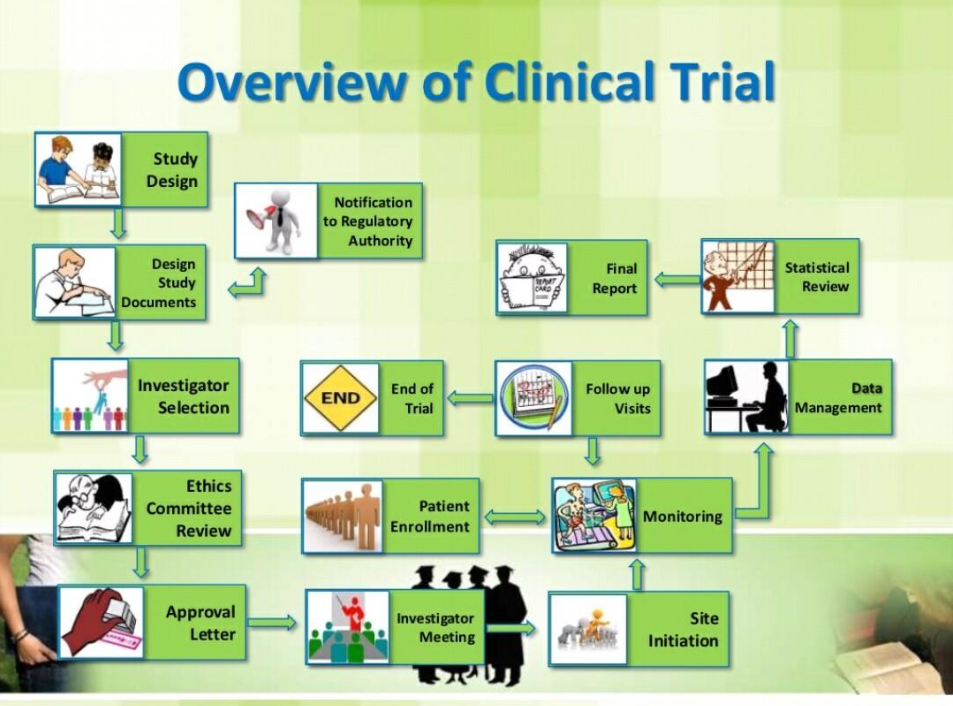
1. Understand structure of clinical trials and how data is collected over time.
2. Understand how raw clinical data from case report forms are stored in SAS datasets.
3. Understand how to clean clinical data.
4. Know how to create descriptive statistics.
5. Know how to apply statistical modeling on clinical data. See SAS paper on SAP review.
CDISC for Therapeutic areas CDISC Glossary
B. Pharmaceutical Terms (NCI Glossary) (Top)
Baseline, Table Lookup, Visit Windows See Drug Exposure in Clinical Data Reporting
Double-Blinded Clinical Study: Both patient nor the site knows which drug is taken. Most clinical studies are double-blinded with the sponsor blinded until the study is unblinded.
Triple-Blinded Clinical Study: Patient nor the site or the sponsor knows which drug is taken. Few clinical studies are classified as triple-blinded.
Active vs Control: Active treatment is the drug that is being tested. Control is the placebo or standard method of treatment.
Dosing - Fixed (500 mg) or variable (bsa - 5 mg/m2, weight - 5 mg/kg)
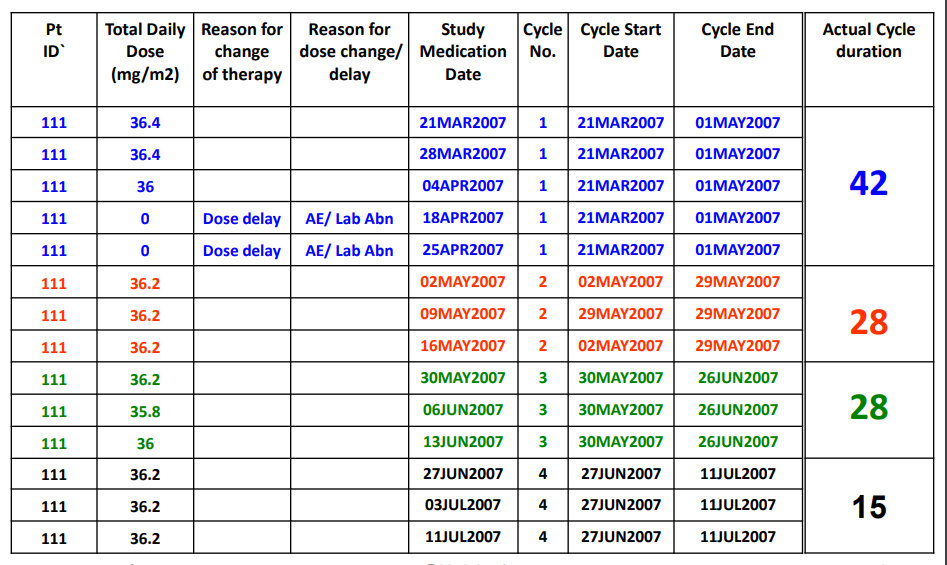
Cycles - ex. 3 of days dosed per cycle, start and stop dates per cycle, (stop date - start date + 1) *exdose
Visit - ex. cycles per visit
Single/Multiple Dose Studies: Fixed, Different or Escalation Doses in phases or cycles
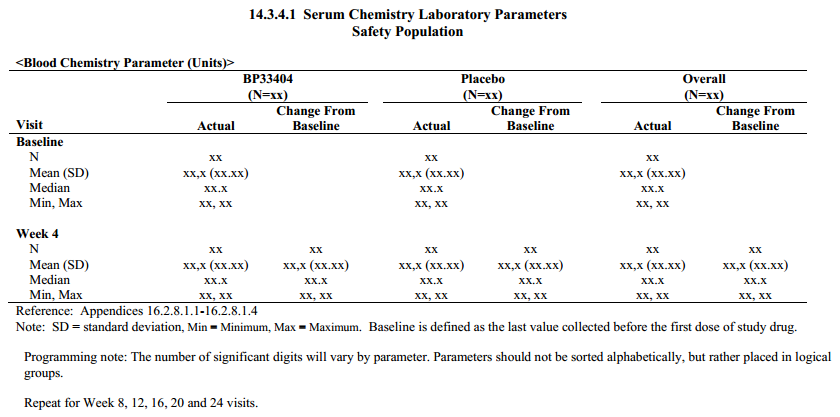
Baseline: For all other parameters, the baseline measurement will be the pre-dose value collected
on Day 1 or if not available, then the last value collected before Day 1. Baseline is not Day 0 since study day 0 is not valid.
Change: Change from baseline at a particular post-baseline time point will be computed as the
value at the post-baseline time point minus the baseline value. For example, base = 10, post-baseline = 15, change = 5 and percent change is 50% (15-10/10) * 100. See lab data.
Duration of Treatment: Total duration of exposure which does not includes the periods of temporary interruption of the study treatment for any reason.
Duration of Exposure (days/weeks): Total duration in which drug is administered to subject/patient. Duration of exposure (weeks) will be computed as the date of the last cycle dose of study drug minus the date of the first cycle dose of study drug, plus 1 day (that is, the study day associated with the date of the last cycle dose of study drug) divided by 7 days per week.
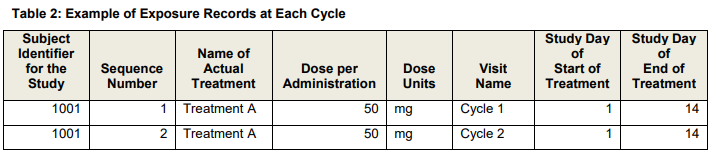
Cumulative dose (mg): SUM of all dose given during the study treatment exposure across all cycles. Total dose is calculated as TDOSE=(DAENDT - DASTDT + 1) * DLEVEL;
Example for one record per visit date (detail);
Example for one record per cycle (summary);
data CUMDOS; set SDTM.EX (where=(EXDOSE > 0)); EXCUMDOS = (EXENDY - EXSTDY + 1) * EXDOSE; run;
Average daily dose (mg): Dose taken per day, average if more than one dose, across all cycles.
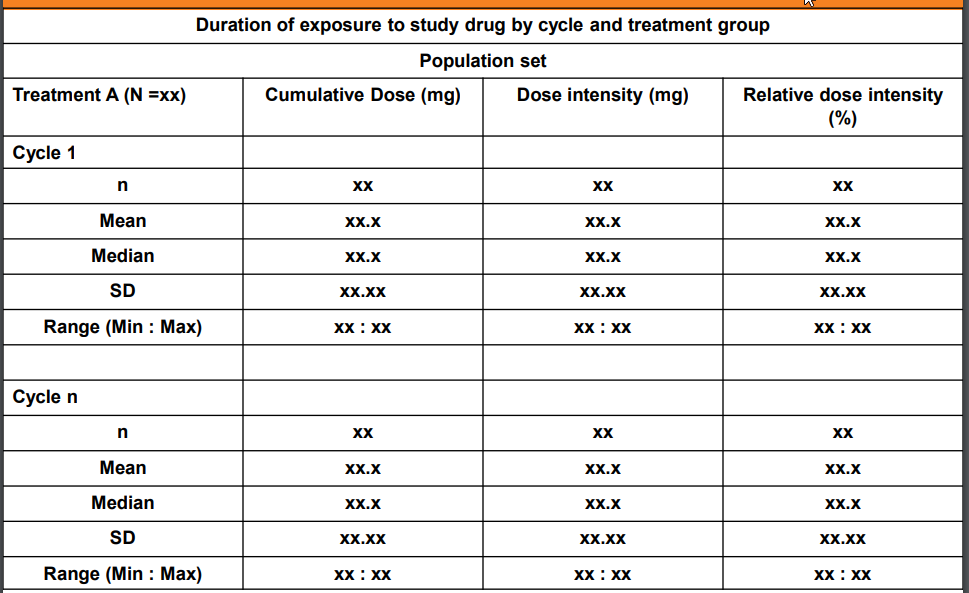
Dose Intensity (mg): Dose intensity is a function of dose and frequency of administration. It is defined as the amount of drug delivered per unit of time. Cumulative Dose / Duration.
Relative Dose intensity - (actual cumulative dose / planned cumulative dose)*100
Actual Dose Intensity – Actual dose / Real treatment durationPlanned Dose Intensity – Planned dose / Total duration.
Relative Dose Intensity – Actual Dose Intensity / Planned Dose Intensity, expressed as a percentage.
proc sql; create table CUMDOS as select patid, count(exdose) as exdoscnt, sum(EXDOSE) as EXCUMDOS , sum(exwgt) as EXCUMWGT , min(exstdat) as minexdt format=date9., max(exstdat) as maxexdt format=date9. , (calculated maxexdt - calculated minexdt + 1) as dosedur , (calculated EXCUMDOS / calculated dosedur) as exavgdosdy format=8.1 from dset.EX (where=(EXDOSE > 0 and exyn='YES')) group by patid; quit;
proc sql; create table compliance as select unique patid, exyn, count(exyn) as counts from dset.EX group by patid, exyn; quit;
Dose reduction: A reduction is defined as a decrease in dose from the protocol planned dose or a decrease from the previous non-zero dose.
Dose interruption: An interruption is defined as a 0 mg/0 tablets dose given on one or more days.
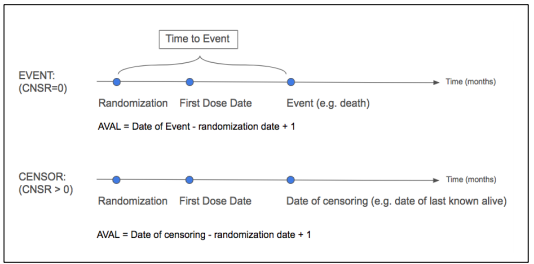
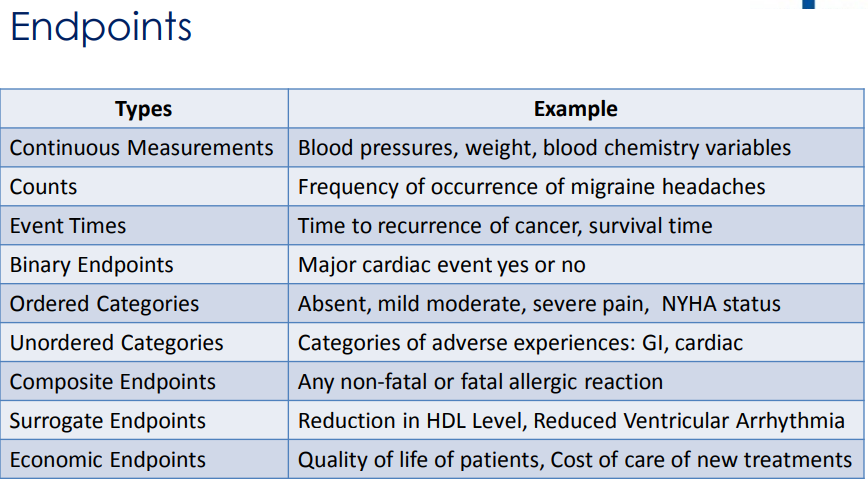
Endpoints - Key study measurements, for oncology for example, overall survival or death, progression free survival (PFS), disease free survival (DFS), objective response rate (ORR), quality of life (QOL) is an example of patient reported outcomes (PRO), Time to Tumor Progression (TTP)
Data Cutoff followed by Snapshot/Data Lock Date - In general, the data cutoff date defines the last visit date to be used in an analysis. In general, the snapshot date is about 1 or 2 weeks after the data cutoff date to allow time for data entry/data query. Once a snapshot is taken, then no more data is entered and all datasets are locked. In the snapshot datasets, if start visit dates exists after the data cutoff date, then those visits or records should be excluded in the snapshot. For end dates after the cutoff date, end dates may be set to missing. Generally, censoring rules should also be applied to define any events after the cutoff date to be censored. See SAS paper for details on subjects on or off study.
Data Checks may include safety population, patient count, selected or maximum visit and date records.
Case study: A sponsor decides to define the data cutoff to be 29APR2013 which is one day prior to the first subject receiving 'rollover treatment (i.e. a switch from treatment B to A). As such, all RAW data sets will be filtered to include information obtained from all clinical study visits up to and including 29APR2013. Sponsors should then identify the specific date variable used for each SDTM as documentation. Snapshot date may be 07MAY2013 which will give it time to collect data up to 29APR2013.
29APR2012 - 29APR2013 (One Year DSUR Reporting Period)
29APR2013 - Data Cutoff (last visit date)
07MAY2013 - Snapshot date (1 week later to collect the data)
FDA: CBER - Center for Biologics Evaluation and Research, CDER - Center for Drug Evaluation and Research
Understandind Clinical Trials Video
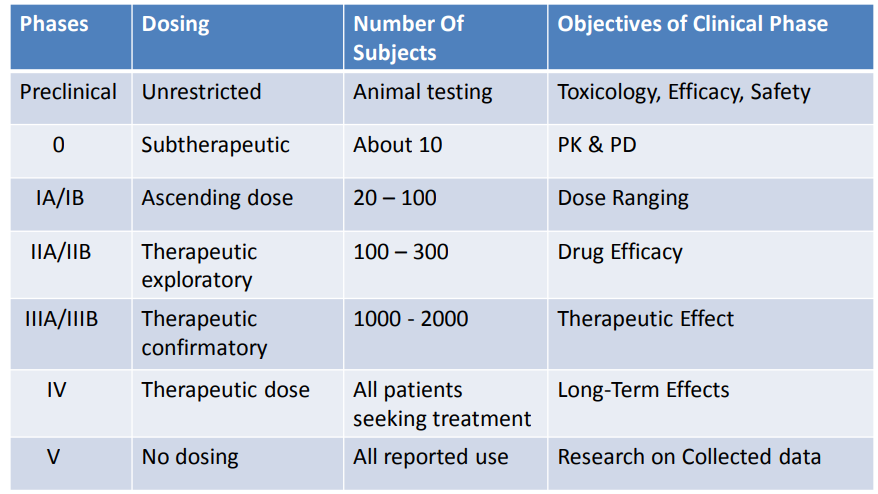
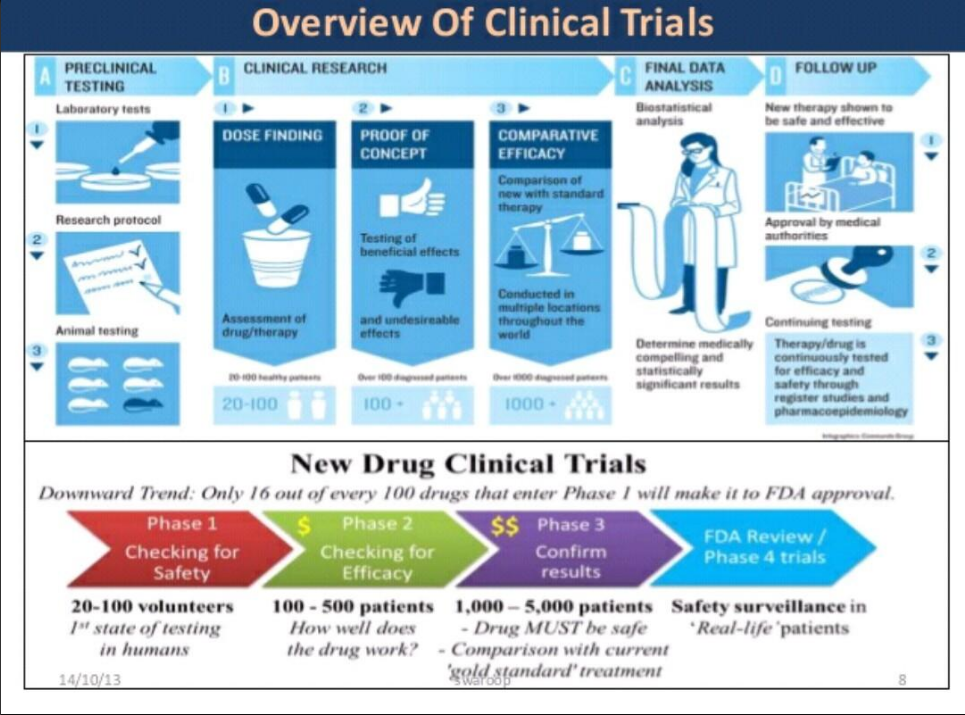
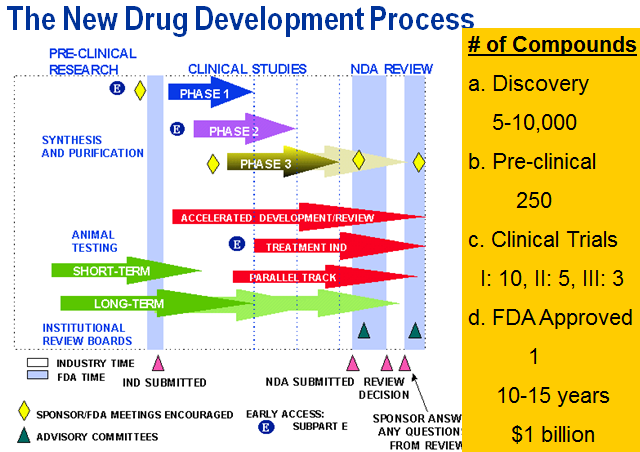
(Early) Phase I - small studies (20-80), evaluate optimum dose and minimum tolerability on generally healthy subjects
(Early) Phase II - larger studies (hundreds), evaluate efficacy dose levels and side effects
(Late) Phase III - multi-center studies, compare with standard treatment
(Late) Phase IV - post-market studies
Study Day: Day 1 will be defined as the first date on which study drug was administered.
Positive study days will be counted forward from Day 1. Day -1 will be the date immediately
preceding Day 1, and negative study days will be counted backward from Day -1. Day 0 is not a value value.
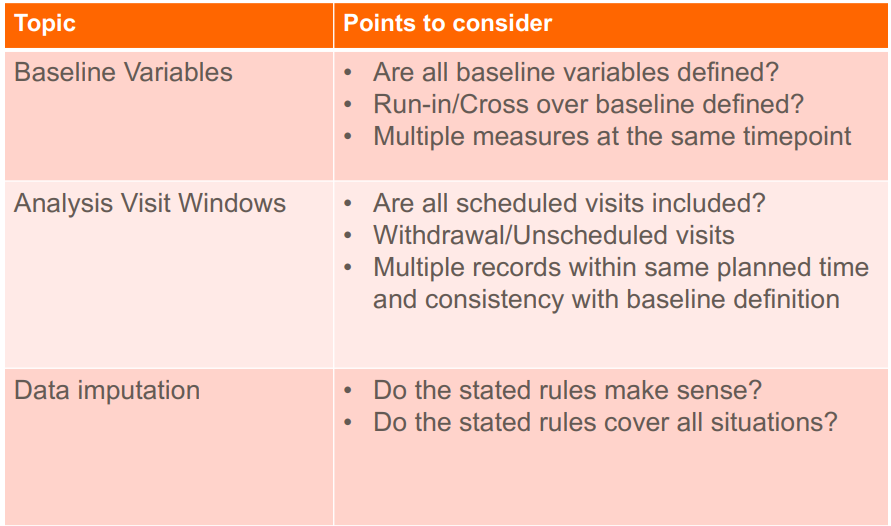
Visit Windows: The benefits of using visit windows is to assure only one visit per visit window period based on start and end dates for periods and visit date and other key dates such as conditional chemo, leukapheresis, treatment date, etc.
Measurements will be associated with a visit for summarizing according to the
study day associated with the date on which the information was collected and within a visit window period based on protocol. Target dates and the acceptable range of study days for each visit should be documented. If multiple visits occur within a visit window, the visit occurring closest to the target day will be selected for summarizing. If there is a tie, the earliest visit will be chosen.
NCI-CTCAE (National Cancer Institute - Common Terminology Criteria for Adverse Events)
Investigator Brochure (IB)
DSUR (Development Safety Update Report)
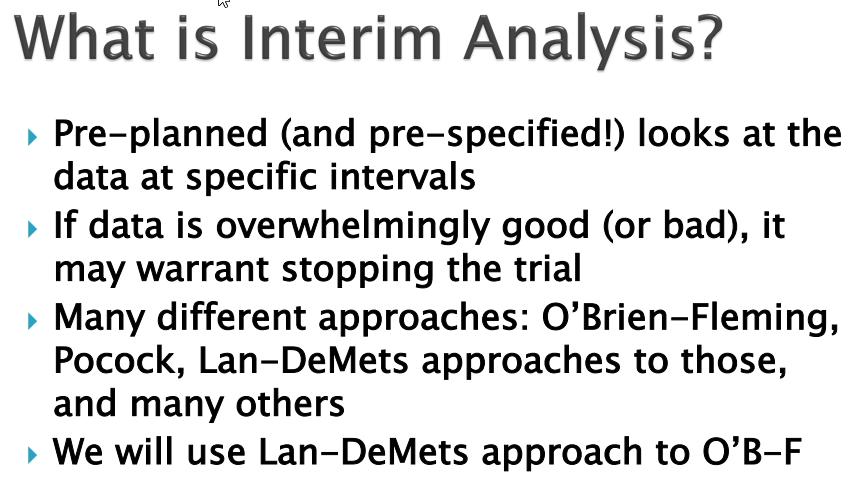
DMC (Data Monitoring Committee)
Outliers - Observations that are quite different from other observations in terms of extreme values such as lowest or highest values or a value outside of the model line. This results in a non-symmetrical distribution curve such as right or left skewed. Both the difference of the extreme values and the number of extreme values are evaluated. Examples are Valid natural variation, measurement errors, incorrect selection of a sample which means entry criteria was not met or data entry error.
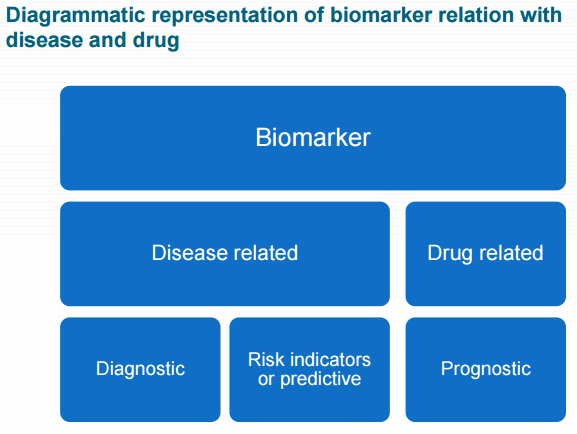
Biomarker - a characteristic that is objectively measured and evaluated as an indicator of normal biological processes, pathogenic processes or pharmacological responses to a therapeutic intervention. For example, a general health check may include assessment of vital signs such as blood pressure, heart rate, cholesterol, triglycerides and fasting glucose levels. Body measurements such as weight, body mass index (BMI), and waist-to-hip ratio are routinely used for assessing conditions such as obesity and metabolic disorders. In cancer research, genetic studies are valuable because genetic abnormalities so often underlie the development of cancer. Certain DNA or RNA markers may therefore help in the detection and treatment of specific cancers. Changes in these biomarker values indicate the decrease or increase of cancer cells. Biomaker data is similar to PK data where small changes are measured within a short period. See SAS paper. See background article.
Immunology - Immunology is the branch of biomedical science that deals with the response of an organism to antigenic challenge and its recognition of what is self and what is not. It deals with the defense mechanisms including all physical, chemical and biological properties of the organism that help it to combat its susceptibility to foreign organisms, material, etc. See info.
Leukapheresis - the selective removal of leukocytes from withdrawn blood, which is then retransfused into the donor.
1. Treatment has no response - refractory – unmanageable, Refractory describes a condition that does not get better with treatment such as test drug or chemo. Your doctor may also say your cancer is resistant.
Refractory - describes a condition that does not get better with treatment. Your doctor may also say your cancer is resistant.
2. Treatment had some response but cancer came back - relapse - (of a sick or injured person) deteriorate after a period of improvement.
3. Treatment response cured cancer - remission - all signs of your cancer are gone
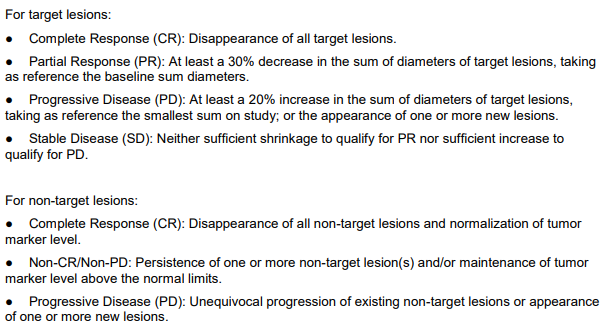
RECIST (Response Evaluation Criteria in Solid Tumor)
Complete remission - Complete response Oncology Disappearance of all signs and symptoms of disease–eg, cancer, multiple sclerosis, with normalization of all biochemical and radiologic parameters, as well as a negative repeat biopsy–pathologic remission.
Non-Hodgkin lymphoma - (also called non-Hodgkin’s lymphoma or NHL) is cancer that develops in the lymphatic system from cells called lymphocytes, which are a type of white blood cell that helps the body fight infections. NHL can develop in many parts of the body, including the lymph nodes, bone marrow, spleen, thymus and digestive tract. T-cells specially destroy healthy cells.
Chemotherapy (often abbreviated to chemo and sometimes CTX or CTx) is a category of cancer treatment that uses chemical substances, especially one or more anti-cancer drugs (chemotherapeutic agents) that are given as part of a standardized chemotherapy regimen.
The spread of cancer from one part of the body to another is called metastasis.
PhUSE Oncology Site Cart-T
Transforming Biomarker Data into an SDTM based Dataset, Kiran Cherukur
Implementation of STDM Pharmacogenomics/Genetics Domains on Genetic Variation Data, Linghui Zhang
Biomarker as essential part of clinical development, Renuka Chinthapally [Presentation]
Path to a Metadata-driven standards environment - collection to submission [poster]
Analysis of Oncology Studies for Programmers and Statisticians, Kevin Lee [Video]
C. Sample Clinical Trials Study (Top)
Timeline: Start study, End study, SDTMs/ADaMs, Database lock and TLGs
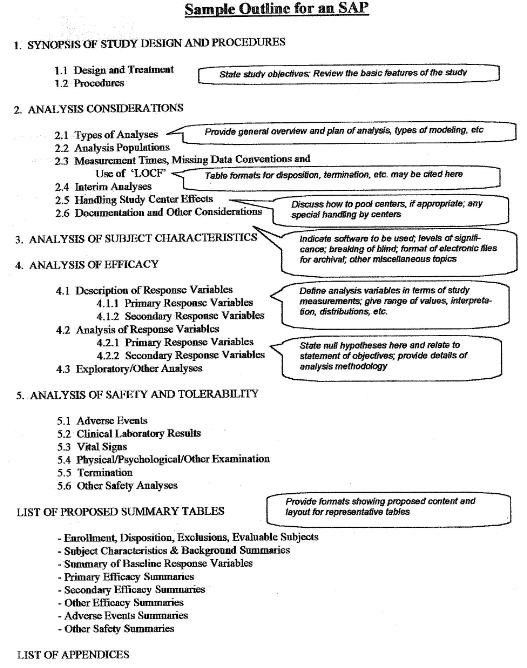
SAP - Statistical Analysis Plan, Template, Example
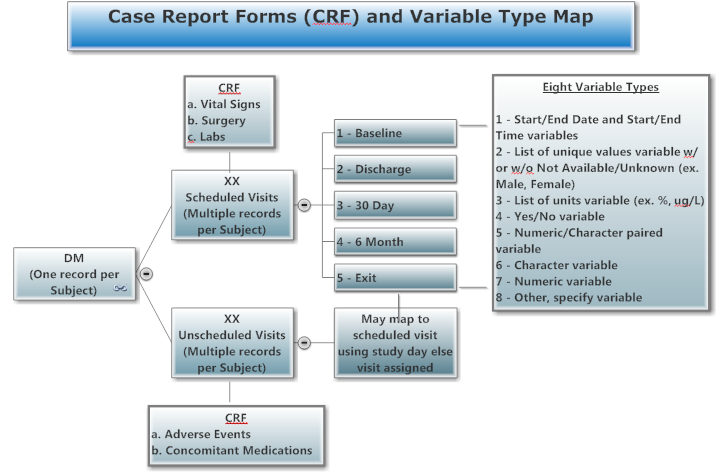
CRF - Case Report Forms, Randomized Controlled Trial
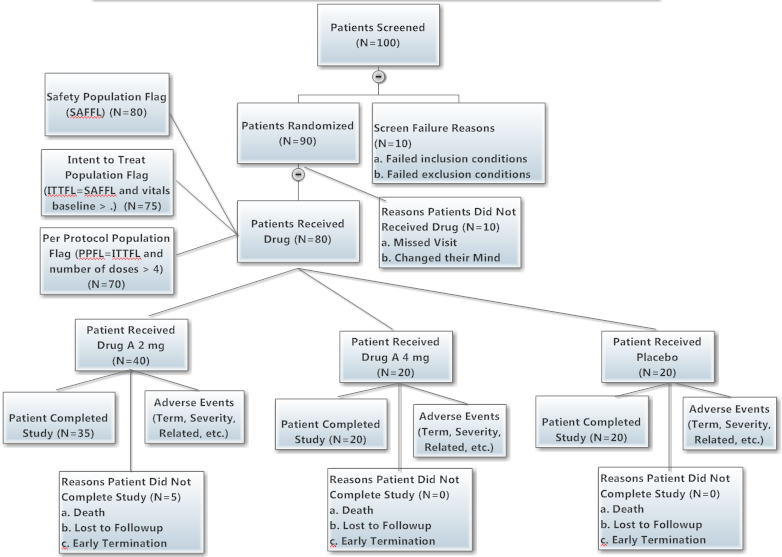
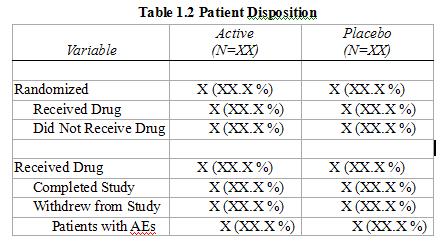
Sample Data, Disposition Tree
 Use a picture, face or story to convey a mission to improve lives.
GCP Refresher and GCP/GCDMP Trends in the CTN (Good Clinical Practices)
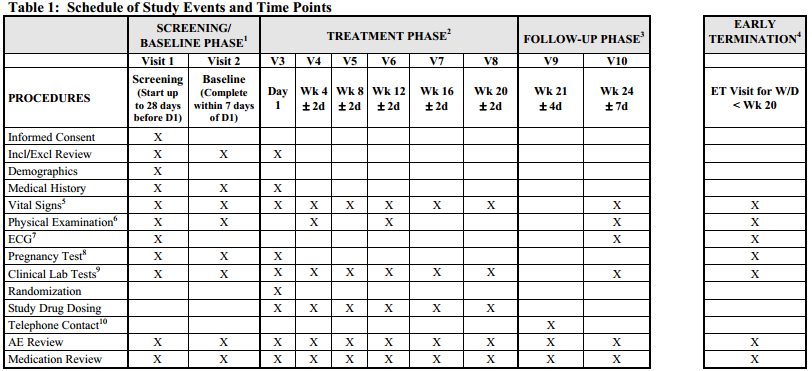
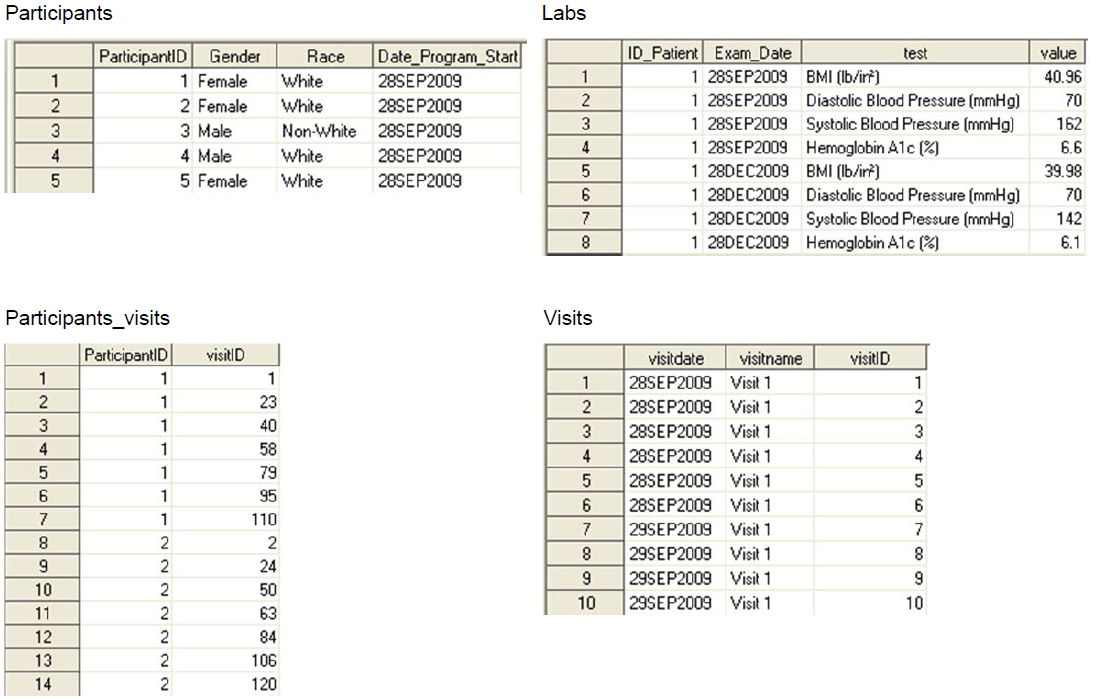
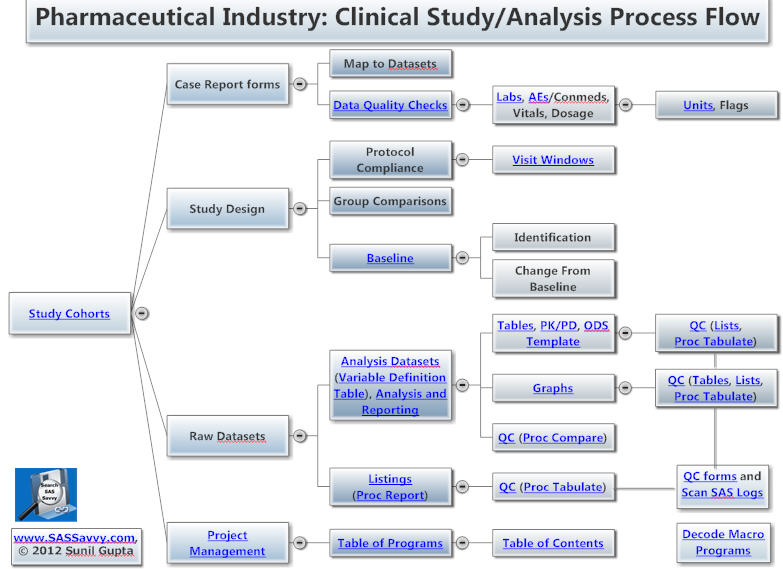
D. Three Types of Data Collected, See CDM (Top)
Set up Clinical Data Management System
1) One record per patient, ex. demog
2) Measurements during protocol visits, may need to sort and subset to get one record per patient such as first dose date or lab baseline flag, ex. vitals, labs, ex, pk/pd, etc.
3) Measurements any time during the study, ex. adverse events, con meds
| Baseline / Screening |
Study |
Followup |
|---|---|---|
Collect: Demo, History and Con Meds Goal: Assure comparable groups |
Collect: Drug Admin, Efficacy Measurement, Labs, Adverse Events and Con Meds Goal: Compare groups - a. Calculate differences in time to 30% decrease in sum of all lesions, b. Counts and percentages of adverse events |
Collect: Status (Dead, LOT, Completed Treatment/Study) Goal: Track completion of each patient |
E. Three Types of Joins, See DATA Step, Proc SQL (Top)
Relationship Model (webgraphviz.com)
Getting an Overview of SAS® Data in Three Steps, Yu Fu, Shirmeen Virji, Miriam McGaugh
Automatically create diagrams showing the structure and performance of your SAS code, Philip Mason
1) One to one record, ex. demog with first dose date from ex
2) One to many records, ex. demog with vitals
3) Many to many records using Proc SQL, maybe required if one visit date is used as reference to anther visit date by visit name, ex. adverse events with con meds
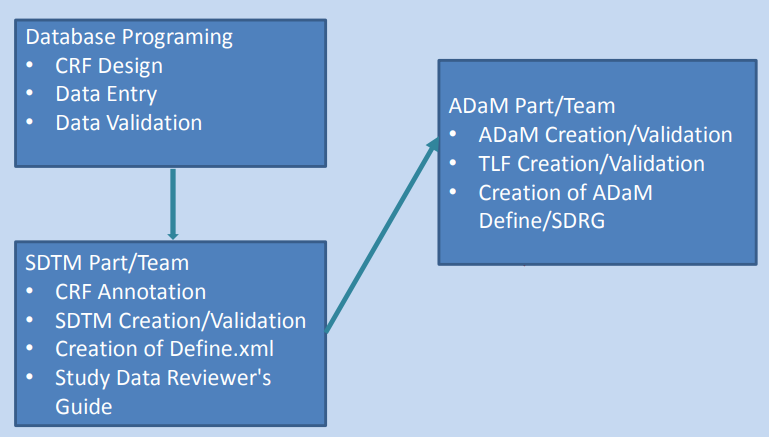
SDTM Specification, ADaM Specification
TLGs Table Shells - Tables, Lists and Graphs QC Checklist
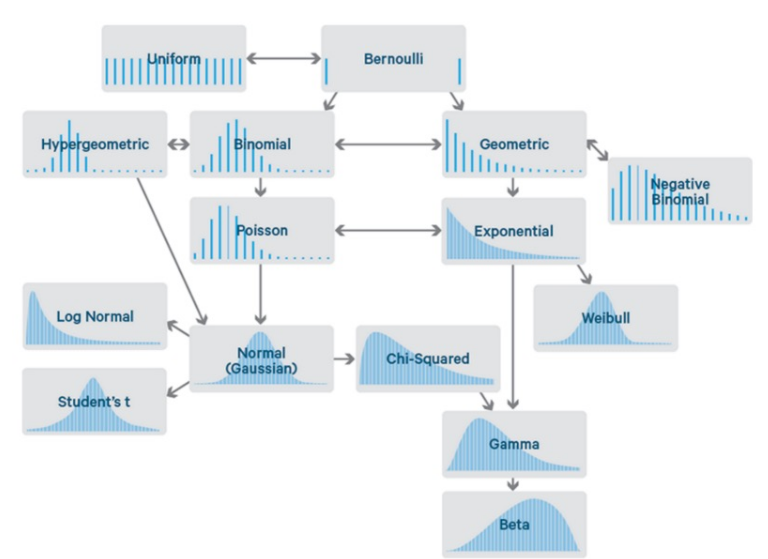
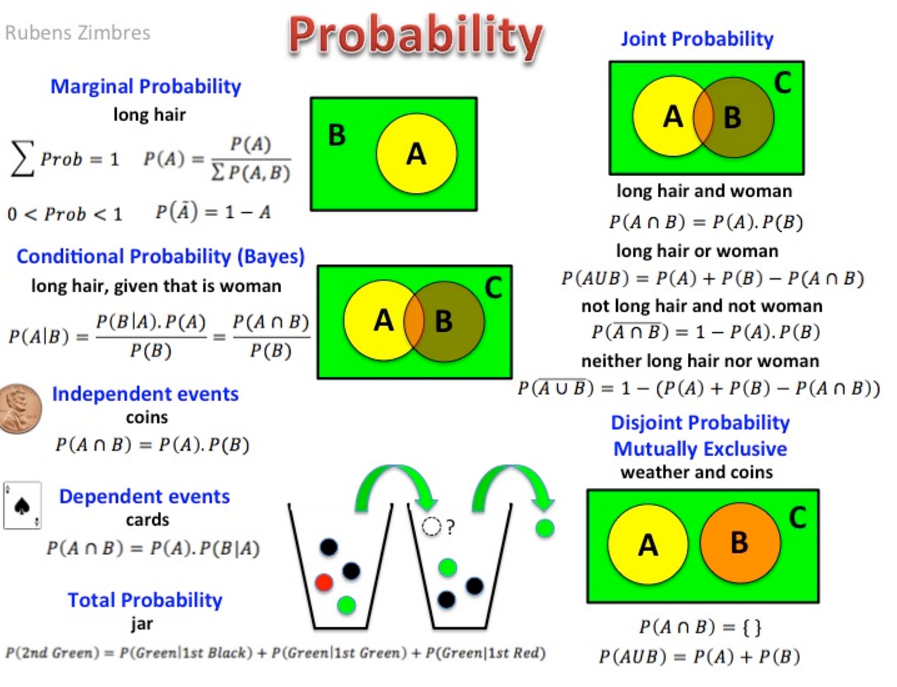
F. Two Types of Analysis, See Statistical Analysis for collection of macros and ODS Statistical Graphics
Introduction to Stats Course Notes with SAS Datasets (Top) See SAS paper.
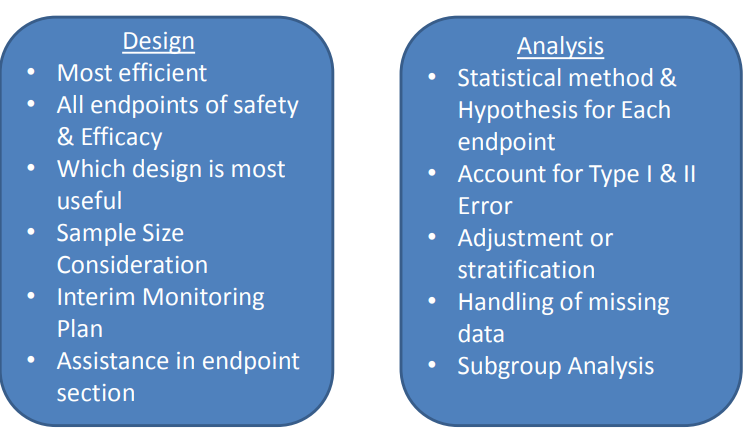
1) Efficacy - based on the primary and secondary endpoints, ex. change in lab measurements from baseline, survival rates
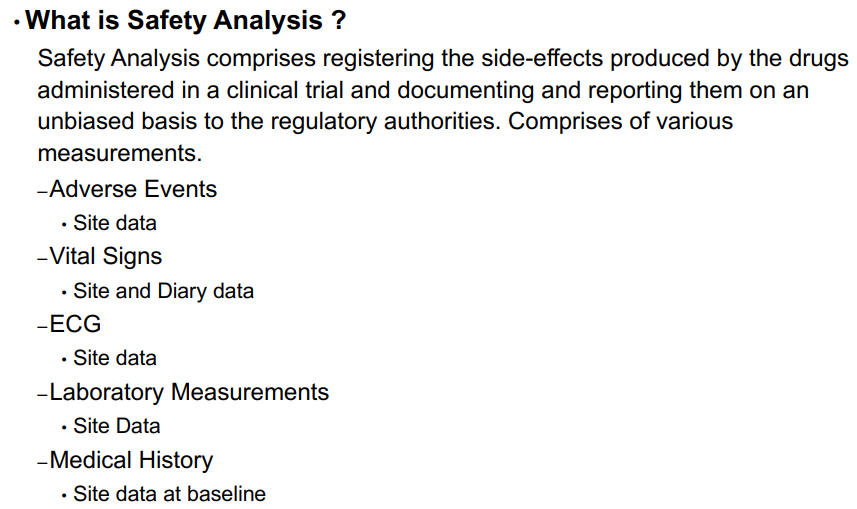
2) Safety - based on adverse events and subject disposition
Waterfall ChartsI. Procs for working with Categorical Data:
Descriptives:
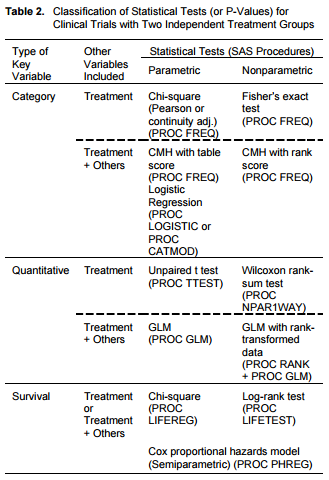
1) Proc Freq (numeric or character variables)
Single variable: oneway tabulation
Two or more variables: crosstabs
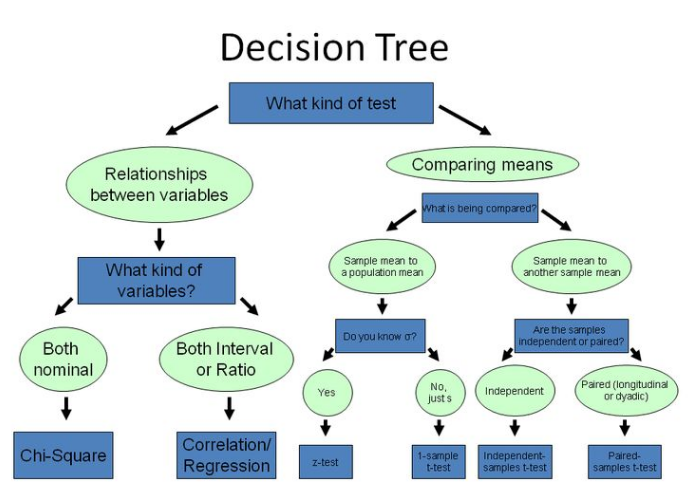
2) Basic Statistical Tests for categorical data:
One variable (with 2 or more levels)
Proc Freq (binomial test for two-level variable)
Proc Freq (chi-square goodness of fit test)
Two variables (each with 2 or more levels), independent groups
Proc Freq (chi-square test of equal proportions, or chi-square test of independence)
Two paired variables (square tables, e.g., 2x2, 3x3, etc)
Proc Freq (McNemar test of symmetry)
3) Graphs for categorical data:
Proc Sgplot (bar charts)
Proc Sgplot (compare means, i.e., sample proportions, across categories)
4) Modeling (outcome variable is categorical):
Proc Logistic: Logistic regression models for binary or ordinal outcome variables
Proc Genmod: Generalized linear models for count, binary, or other outcome variables (exponential family of distributions); predictors may be nominal, ordinal, or continuous.
Proc Glimmix: Generalized linear mixed models for count or binary outcome variable, including random effects, or correlation matrix for longitudinal or clustered data (exponential family); predictors may be nominal, ordinal, or continuous.
II. Procs for working with Continuous data:
1) Descriptives: Proc Means, Proc Univariate
2) Basic statistical tests:
One Sample
Proc Univariate (one-sample t-test, nonparametric tests)
Proc ttest (one-sample t-test)
Two Independent Samples
Proc ttest (independent samples t-test)
Proc Npar1way (Wilcoxon non-parametric analog of t-test)
Paired Data (correlated data)
Proc ttest (paired t-test)
Three or More Independent Samples
Proc GLM (oneway analysis of variance (ANOVA))
Proc Npar1way (Kruskal-Wallis non-parametric analog of oneway ANOVA)
3) Modeling:
Proc Reg: Linear regression models for continuous outcome variable, continuous, ordinal or binary predictors (prior creation of dummy variables required for categorical predictors with more than 2 levels, interactions must be created prior to running model)
Proc GLM: Linear models for continuous outcome variable, predictors may be nominal, ordinal, or continuous.
Proc Mixed: Linear mixed models for continuous dependent variable, longitudinal or clustered data; predictors may be nominal, ordinal, or continuous.
Proc Nlin: Nonlinear models for different types of dependent variables.
Proc Nlmixed: Nonlinear mixed models
III. Graphing:
Proc Univariate (histograms, qqplots) for one-sample data
Proc Sgplot (histograms)
Proc Sgplot (boxplots for continuous variables for each level of a categorical variable)
Proc Sgplot (barcharts, showing mean and standard deviation or standard error of mean)
Proc Sgplot (bivariate scatter plots, regression plots) for two related variables
Proc Sgscatter (scatterplot matrix)
G. Five Types of Tables, See Clinical Data Reporting (Top)
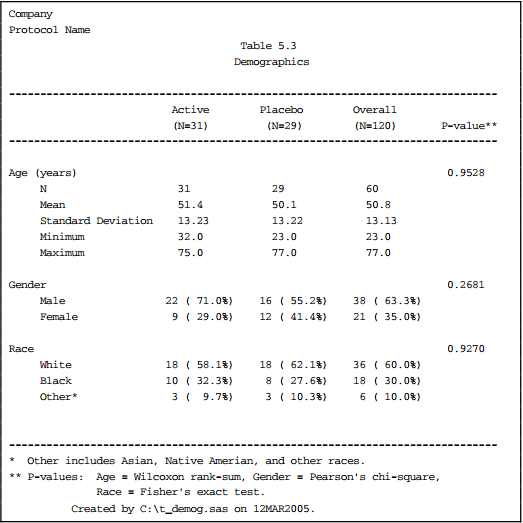
1) Data Listing, ex. demog characteristics
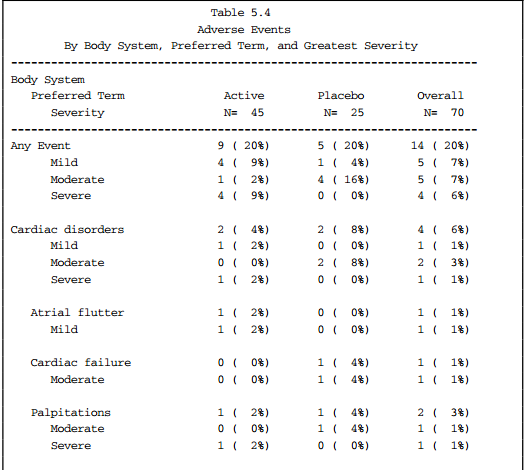
2) Counts and Frequency of categorical data, ex. proportion of patients with adverse events
3) Summary Table of continuous data, ex. descriptive statistics (mean, sd, min, max) by visit
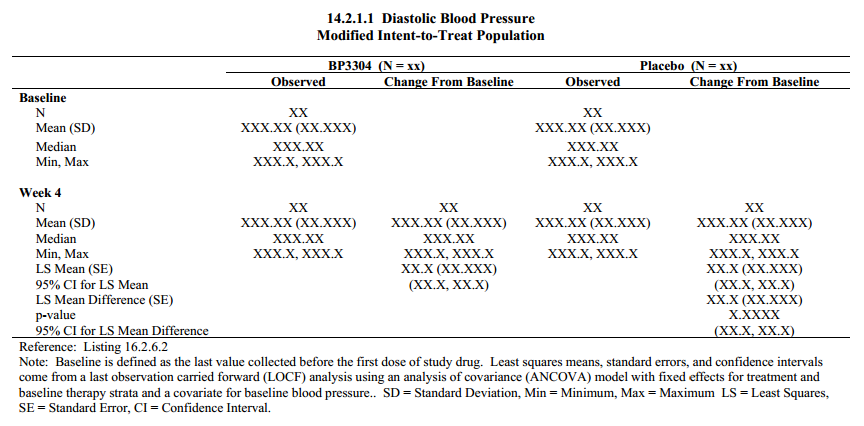
4) Statistical Analysis Table to model data, ex. descriptive statistics by visit with p-value, survival analysis using Kaplan-Meier (Proc LIFETEST)
5) Graphs, ex. lab scatter plot
6) 7 Types of Regression Techniques you should know!